- Город
- New York
- На сайте с
- 2012 года
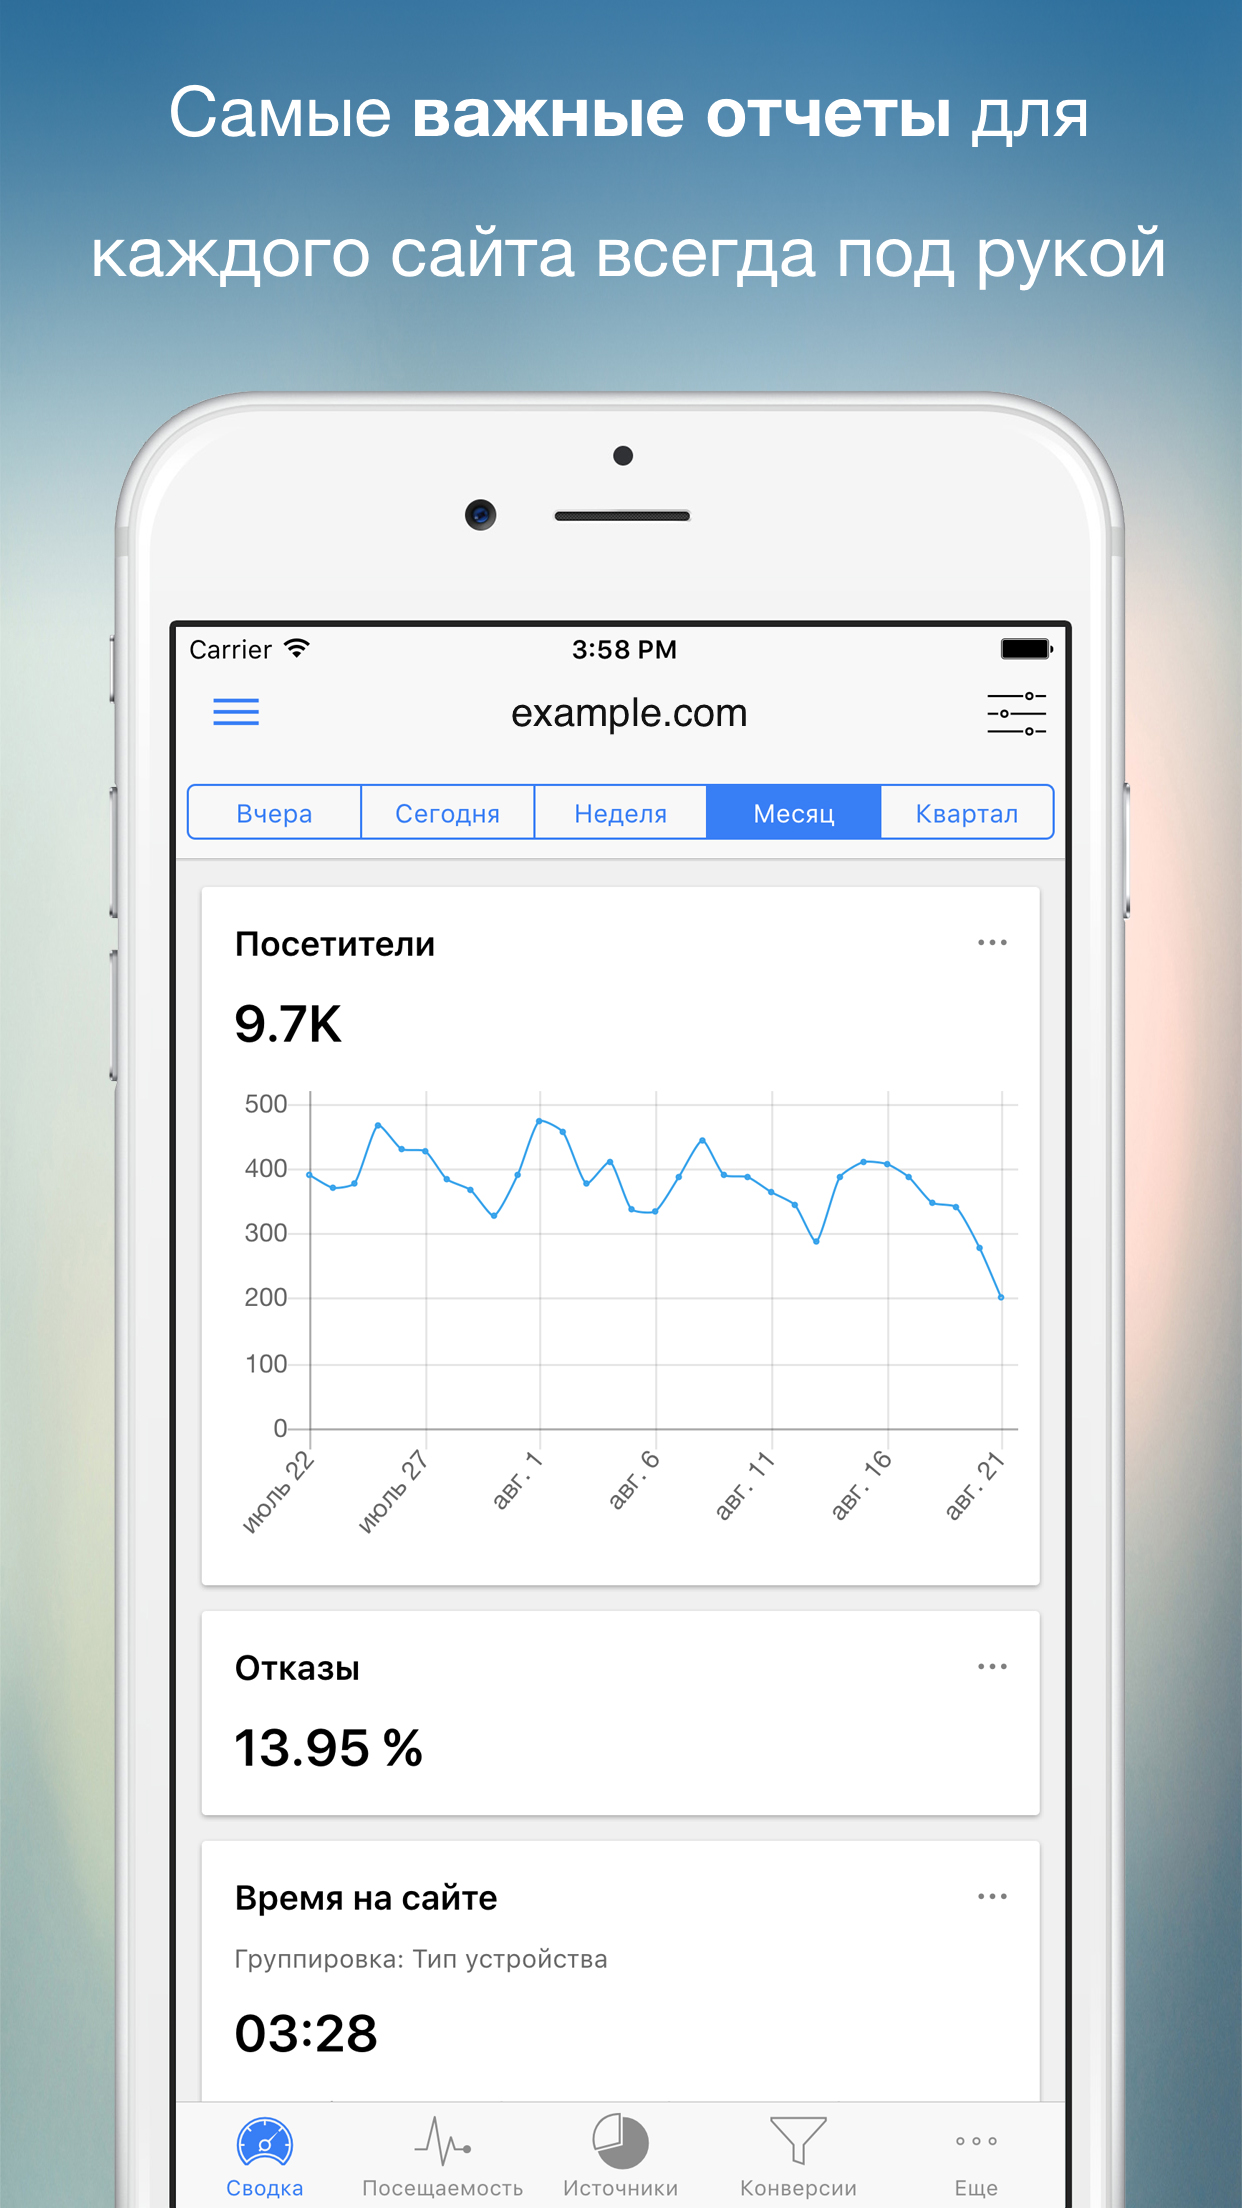
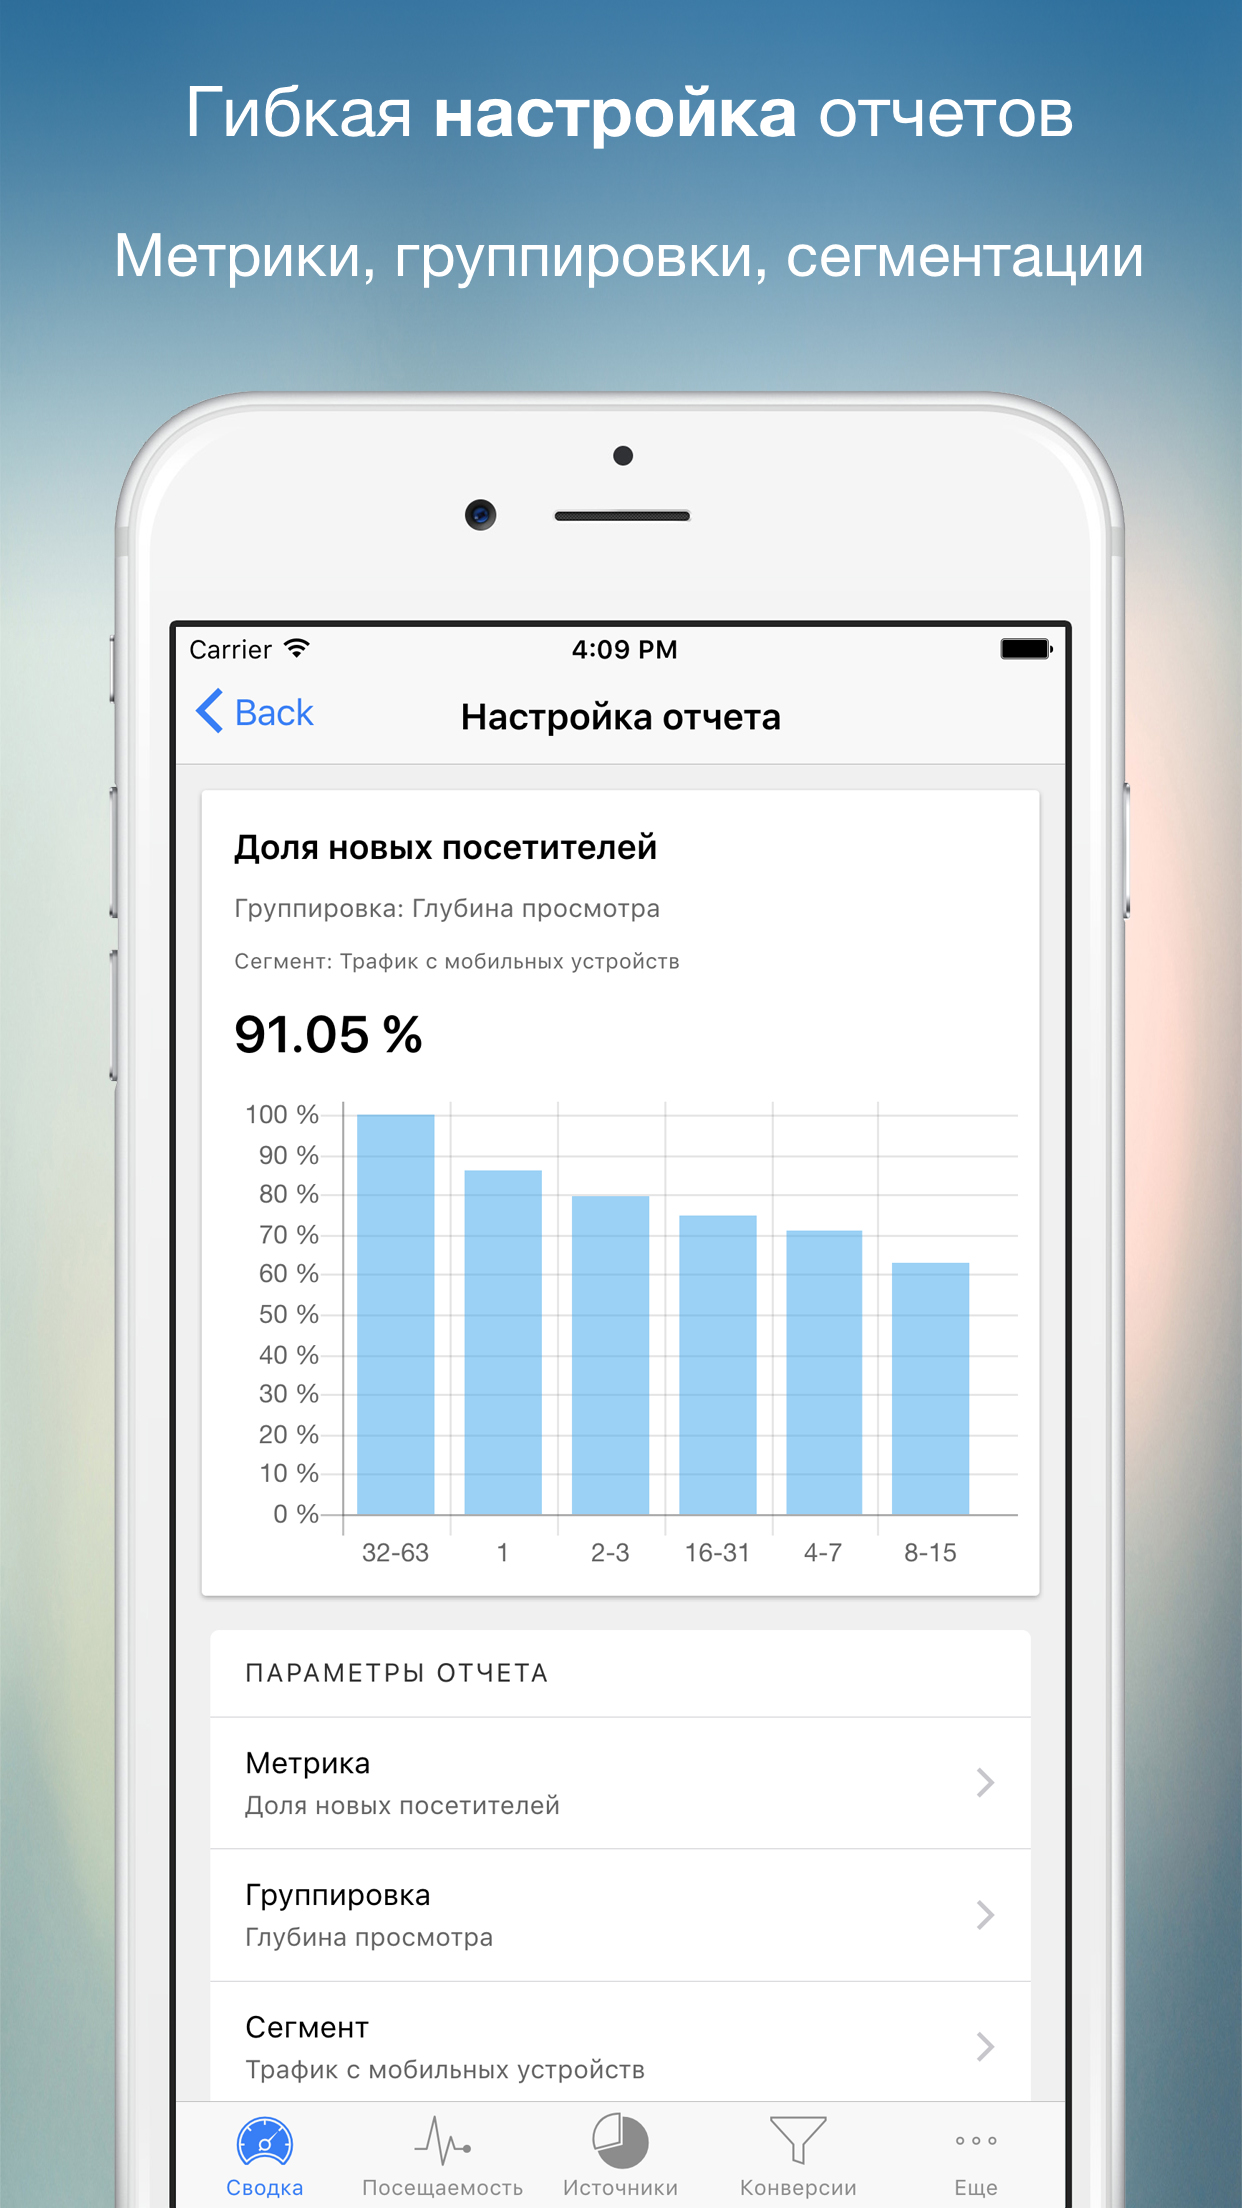
Customisable reports. Ability to select a metric group, a segment for the dashboard reports. A comparison with the previous period. 3 types of data representation: line graph, bar graph and table. A set of standard reports: Attendance, sources of visits, conversion goals, geography, interests, age, gender, depth of view, time on site, entry page, exit page, browsers display resolution devices.
https://bushev.github.io/ya-analytics/