Аналитик данных | Python, Excel, Power BI, WordPress
- Опыт работы
- 6 лет
- На сайте с
- 2026 года
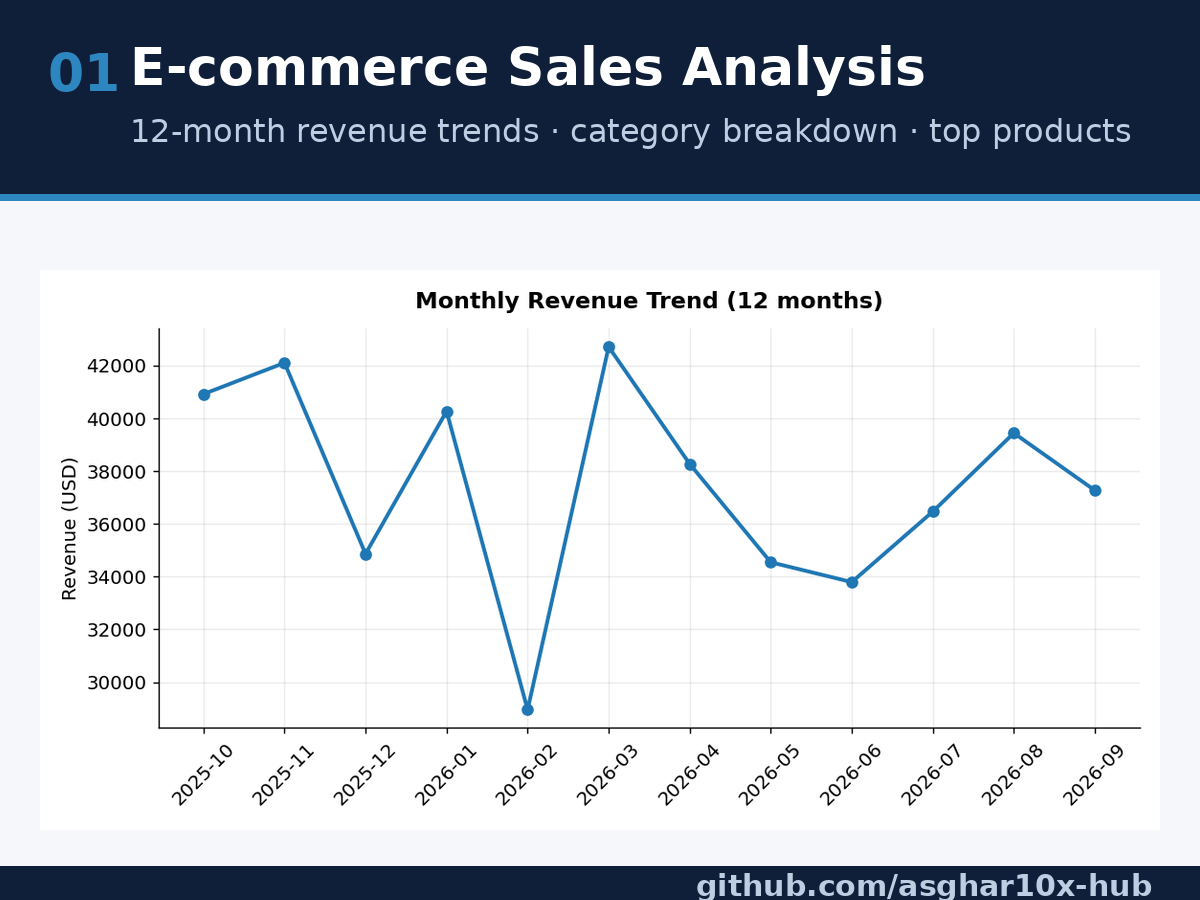
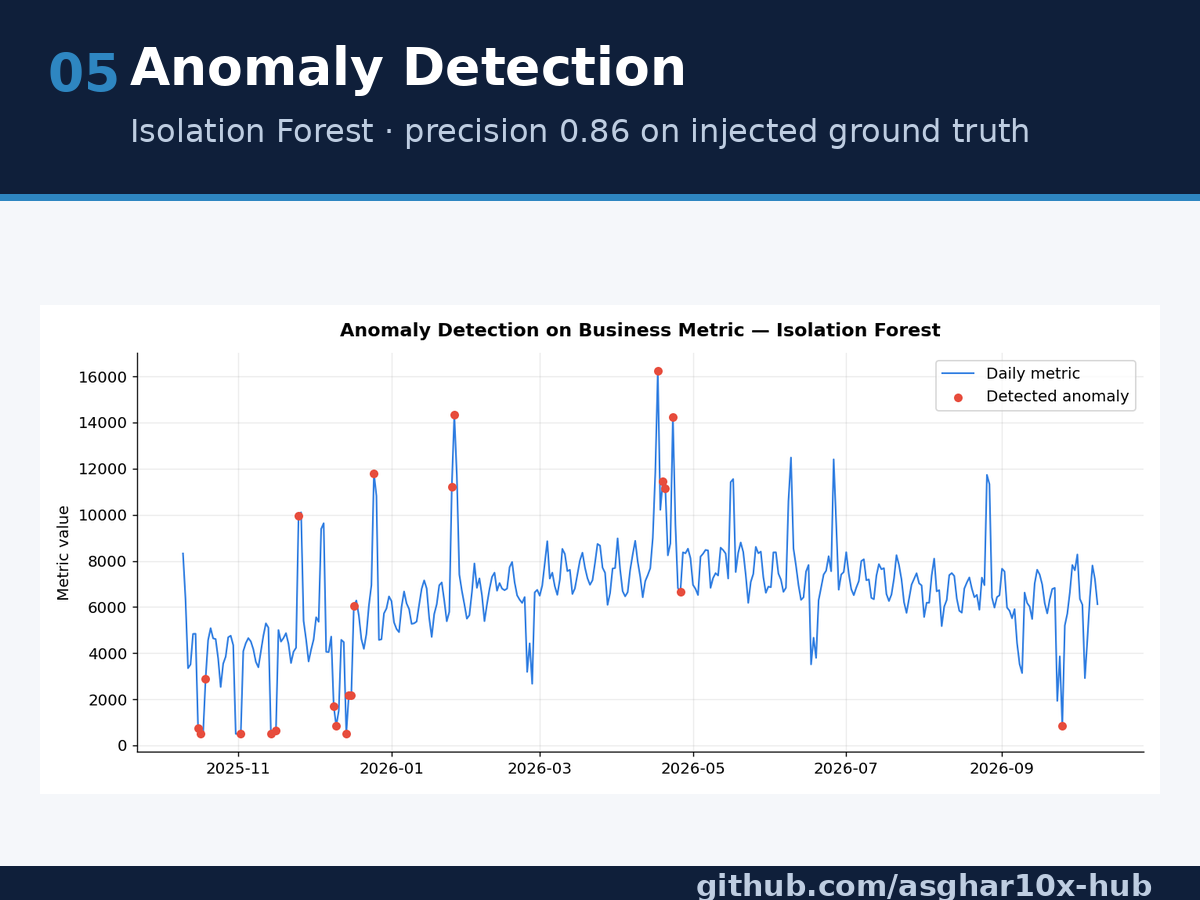
Analysis of 12 months of online-store orders (2,000 orders, Oct 2025 – Sep 2026) to find revenue drivers, sales slumps, and customer-segment revenue shares. Includes monthly KPIs, category and top-product breakdowns, regions, 4 charts, a one-page executive summary and proposed action steps. Results: total revenue $449,635, average order value $224.82. Best month March 2026 ($42,713); Electronics 49.0% of revenue; top product Wireless Headphones ($59,780). New customers 44.8% of revenue ($201,490.68), returning 39.4% ($177,313.96), VIP 15.8% ($70,830.70). Regions: North 26.8%, East 25.9%, South 24.8%, West 22.4%. Tools: Python, pandas, NumPy, Matplotlib.